World daily temperature records smashed -- here's how we know / Photo: © AFP
World daily temperature records have been smashed this week, according to preliminary data.
The modeling tools that produced these estimates can provide an early warning of extreme heat events, even if they aren't as precise as monthly and yearly reports produced by leading agencies, say experts.
- Who is producing the data? -
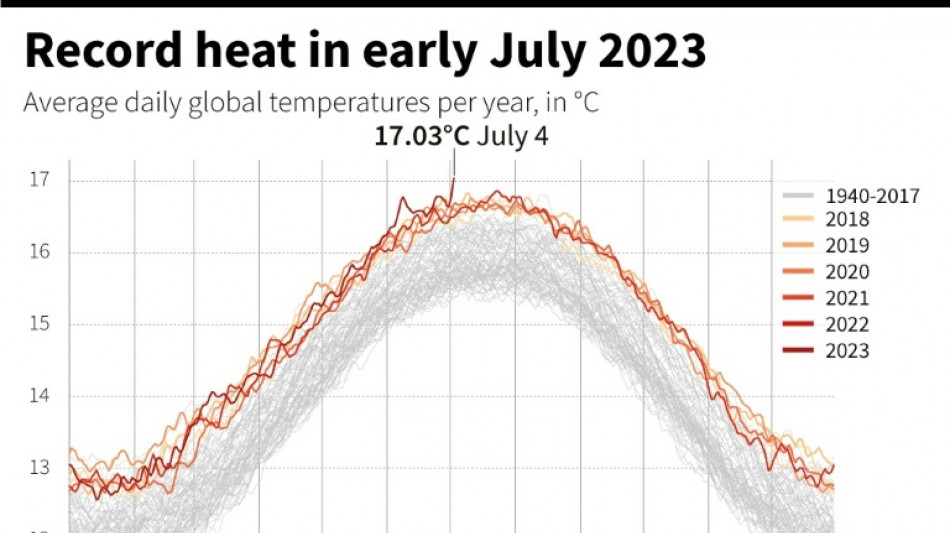
The University of Maine has established an online tool called Climate Reanalyzer, which shows the curves of average global temperature for each day since 1979.
On Monday July 3, this curve reached a high of 17.01 degrees Celsius (62.62 degrees Fahrenheit). That record was surpassed on Tuesday with 17.18C (62.92F), and again on Thursday with 17.23C (63.01F).
Europe's Copernicus Climate Change Service, which has a similar tool, later confirmed the records of Monday, then Tuesday, albeit with slightly different figures -- 16.88C (62.38F) and 17.03 (62.65F), respectively.
- How do they arrive at their figures? -
The estimates are produced through a combination of actual temperature measurements -- from ground stations, satellites, and more -- with computer modeling.
The two tools are conceptually similar but differ in their exact sources and methods, leading to the slightly different results.
The University of Maine relies on public model output data produced by the US National Oceanic and Atmospheric Administration (NOAA) for forecasting.
NOAA, for its part, said that although it was seeing record warm surface temperatures being recorded at many locations across the globe, it could not "validate the methodology or conclusion of the University of Maine analysis."
NOAA instead vouches for its own monthly and annual temperature reports.
The fact that the both results converge is reassuring, Zeke Hausfather, a climatologist at Berkeley Earth told AFP.
The European tool is considered "very much state of the art," by the wider community, he added.
- What are the limitations? -
"These are estimates, unofficial records," University of Maine climate scientist Sean Birkel, who developed Climate Reanalyzer, told AFP.
"The greatest emphasis should be placed on an annual and monthly timescale," he added, with these reports subject to greater checks and verifications than is possible for daily records that rely on near real-time information.
On Thursday, Copernicus separately released its analysis for the past month, announcing it was the hottest June on record. A similar monthly report from NOAA is expected next week.
These reports are based "solely on observations" from the land and sea, and gather far more data points, explained Hausfather.
In general, climate experts prefer to focus on long-term trends and changes, in order to eliminate variations simply related to weather.
What's more, the concept of a global average temperature is a bit abstract and not necessarily as meaningful for the general public.
"No one lives in the global average," said Hausfather.
- What is the value of daily record estimates? -
Despite these limitations, the value of daily records is "we can start to identify extreme events," which could have climate significance, said Birkel.
Though temperature at the daily timescale is weather, not climate, adding in 40 years' worth of data provides important climate context, he says.
"These provisional records provide another piece of evidence of the global climate pattern shifts due to climate change and the evolving El Nino episode," said Omar Baddour, chief of climate monitoring at the World Meteorological Organization.
"I think this is a sign that we're heading into a very hot period. June was the warmest June on record by a pretty big margin," said Hausfather. "At this point, it looks increasingly likely that 2023 as a whole will be the warmest year since records began in the mid 1800s."
N.Wan--ThChM